e-Broker Manual
This manual covers basic activities within the e-Broker application and provides a detailed guide for how to login to the application, what the individual selections in the main navigation bar actually do, how to search for a title using various criteria and how to set up e-Broker to match your needs and to use basic technical analysis functions, etc. - start here.
e-Broker provides many useful features for beginners and advanced investors.
A detailed description of the full version of the e-Broker application and all options and functions are found in the following document. The appropriate section of the manual concerning the e-Broker application can be opened at any time by clicking on the Manual link in the upper navigation bar in the full version of e-Broker. The manual is not accessible from the navigation bar in the basic version and the basic version does not contain details as to the functions contained therein.
Quick Guide to the e-Broker Application
- Searching
- Buying/Selling
- Orders and Trades
- Portfolio
- Securities
- Settings
- Other
- Fundamental Analysis
- Technical Analysis
- Security
Searching for Securities
Quick search
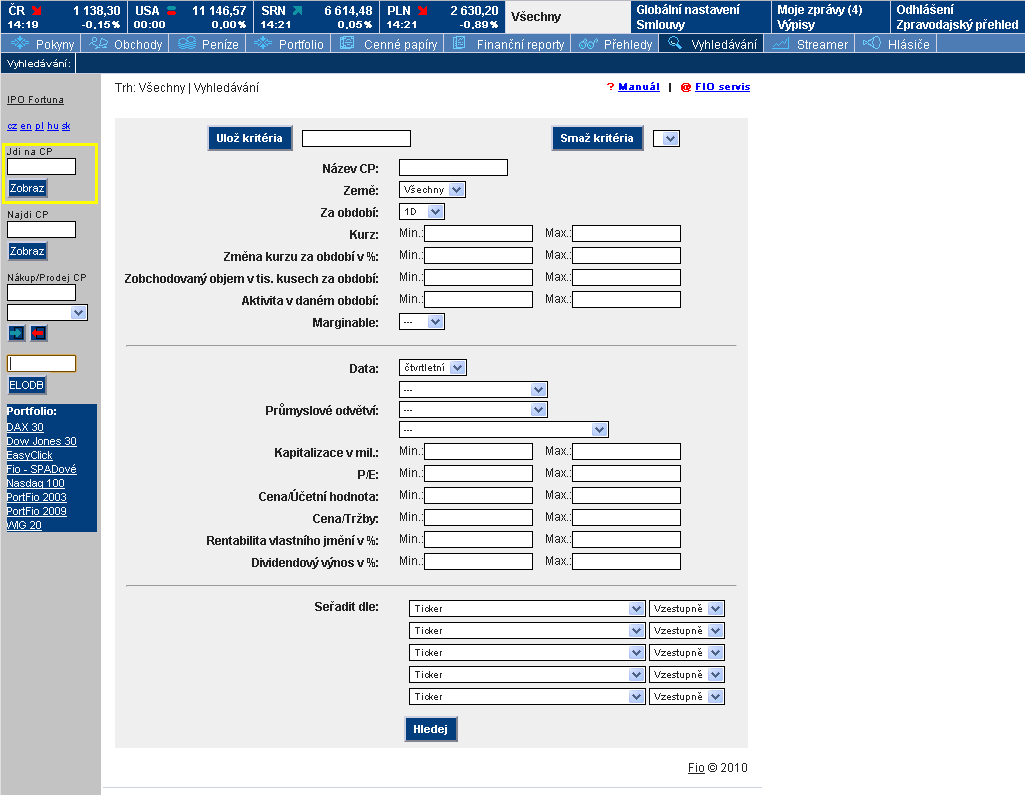
Quick links "Find" and "Go to" are used in the e-Broker application to quickly find and display a selected security title. These choices can be found in the vertical menu to the left that is common to all pages of the application.
FIND
The name of a company or part thereof can be entered into the "Find" field. The search starts by clicking on "Display".
GO TO
If you know the symbol for the security (i.e. ticker), enter it into the "Go to" field. The search starts by clicking on "Display".
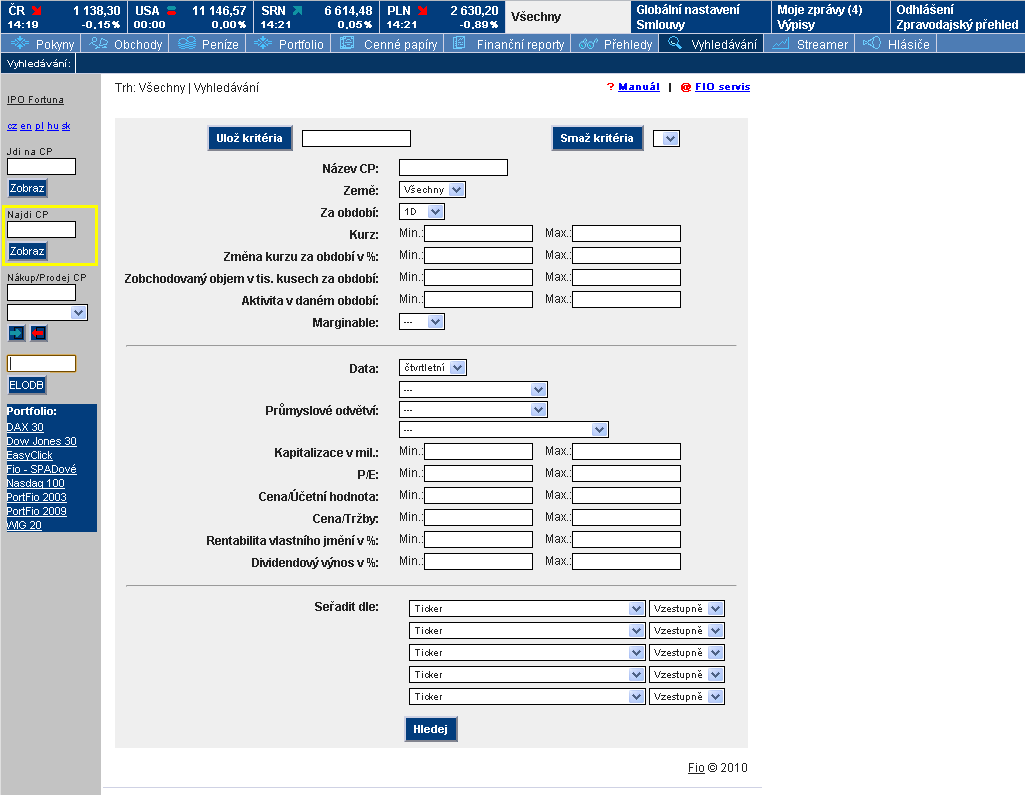
Advanced Search
The application also supports searching for and displaying a number of securities that meet defined parameters and entered criteria. If you search using defined parameters on a frequent basis, you can save your search forms using a special name, thereby creating a template so you don't have to keep filling in the same data.
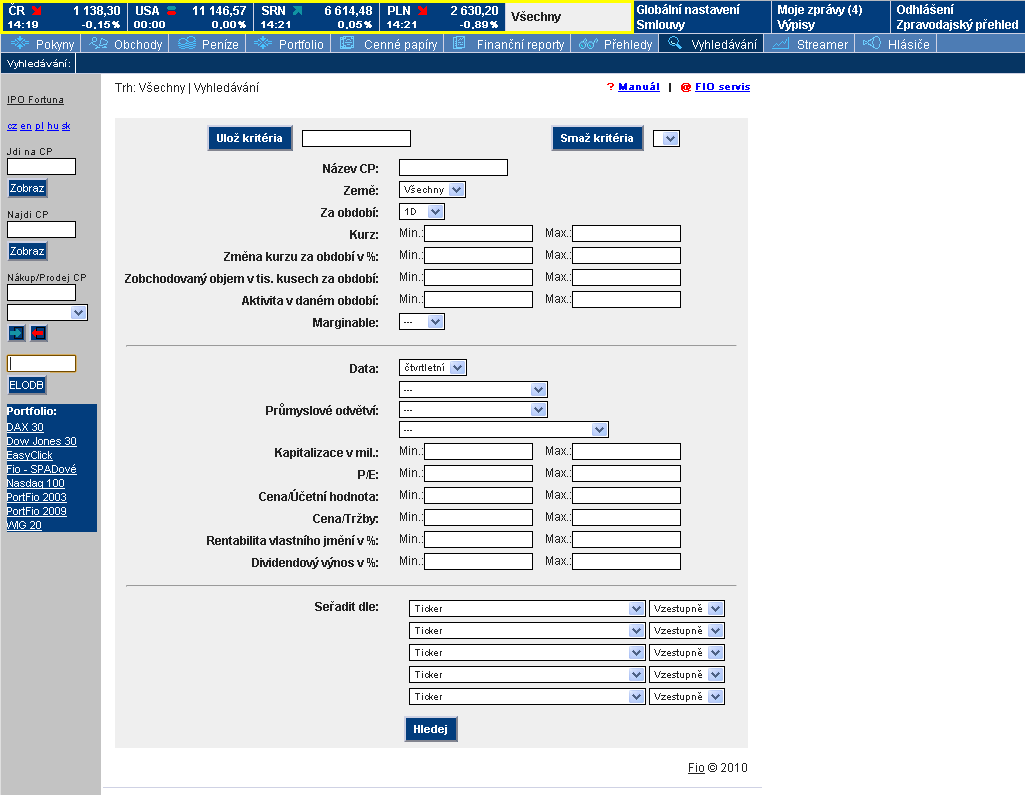
Advanced search can be found in the upper navigation bar in the "Search" tab.
Search uses technical criteria (country, period, min. and max. price, change in price over a given period, volume and activity) or fundamental criteria (industrial segment, market capitalization, P/E, dividend yield and more). The results can be sorted using select parameters.
If we take the P/E indicator or the ratio of a stock price to profits per share, the average value fluctuates across various segments. This indicator, however, remains the basic criteria for assessing the relative value of a stock (even through this indicator has a full range of limitations and there is always a reason if its value is very low). The average P/E ratio value for a stock listed on the S&P 500 over the past 50 years is around 17. A range from 10 to 15 for stocks with higher market capitalization may be set to filter out the "cheaper" stocks.
Note:
When searching using the quick links "Find" and "Go to" it is important to select the "Country" filter in the upper part of the application. If the filter is set to "USA" then the search results will only show securities that are traded on markets in the USA. If this filter is set to "All" countries, the search results will show securities that are traded on all markets offered by Fio banka.
The "Search" tab is accessible only in the full version of the application. You can select the full version of the application in the "Global Settings" located in the upper right-hand corner of the e-Broker application.
Buying and Selling Securities
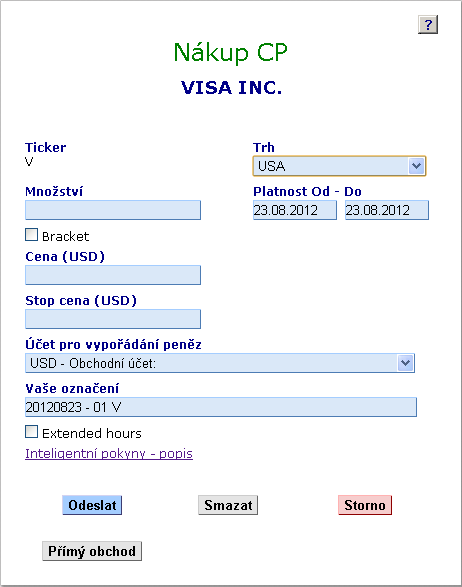
Orders to buy and sell a specific security title can be entered in real time in the e-Broker application.
Click on the green arrow symbol to submit a buy order for a selected security or click on the red arrow symbol to submit a sell order for a selected security. The order window opens and you can then enter the order's parameters. These parameters include the share price at which you are willing to buy or sell, the quantity and validity of the order. The order is then generated and is immediately sent to the given market (stock exchange).
Intelligent Orders
The Fio banka trading system supports the use of intelligent orders, which represent an automatic reaction to buy or sell a given security depending on a pre-defined market scenario. The investor alone defines what to do with open positions based on an investment strategy. Examples include locking in the best buy or sell price, limiting losses above a pre-defined level or hiding order parameters in order to ensure that other parties on the market are not influenced by specific positions.
A Stoploss order is one of the most commonly used orders. Stoploss is use to protect against losses. This means that a pre-defined price is set at which held securities will be automatically sold if the price drops to such level.
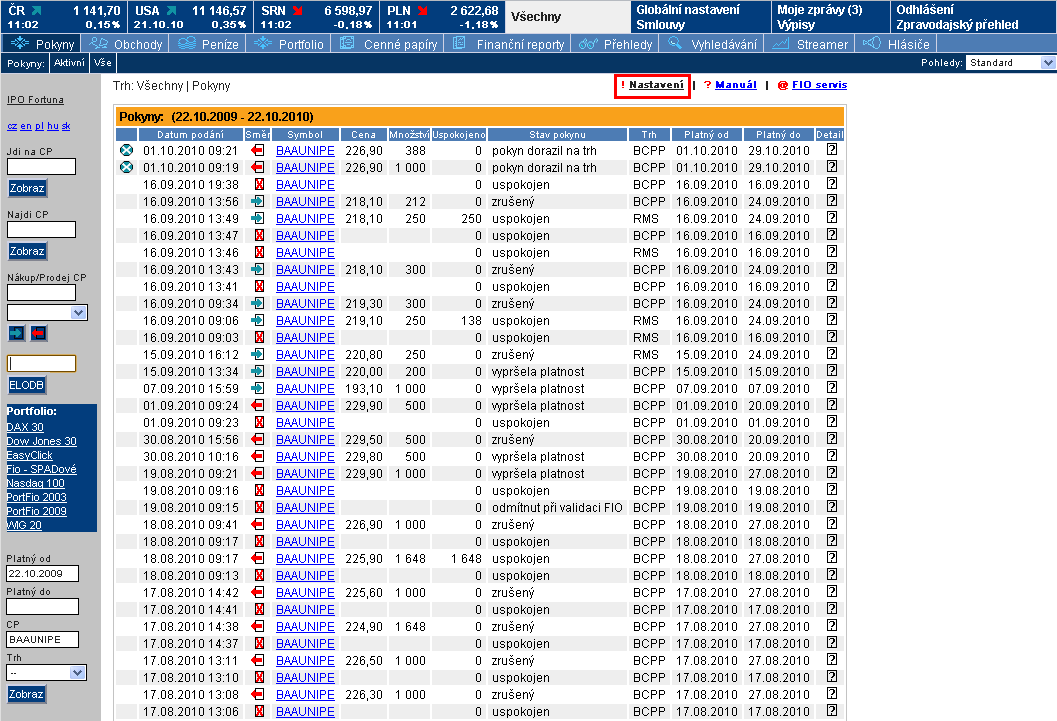
Orders and Trades
A complete overview of all types of orders can be found in the "Orders" tab. Here all of the orders that you've place in a given period of time are displayed including those that were cancelled or rejected at validation. Any unsatisfied orders can also be cancelled here.
The overview of all completed trades in a given period of time can be found in the "Trades" tab. This provides information about the price of a trade, the volume of a transaction, the fee for the trade, market and other information including dividends paid out by holding a given security or any other operation or service completed on a trading account.
All data (displayed in columns) can be adapted to meet your specific needs by simply using the "Settings" section in the upper right-hand corner of the application. Data can also be exported to CSV format and then further processed in any spread sheet software.
Trading Account Balance
The application also includes the "Funds" tab that is used to provide more details about the trading account balance. Amounts denominated in the CZK, EUR, USD, HUF and PLN currencies can be held on a trading account, which is particularly advantageous for clients trading on foreign markets.
If you want to trade in the USA for instance, there is no need to have a sufficient USD balance in the account - simply used the "Forex conversion" table to convert between currencies or take advantage of a currency loan, which also provides protection against foreign exchange risk.
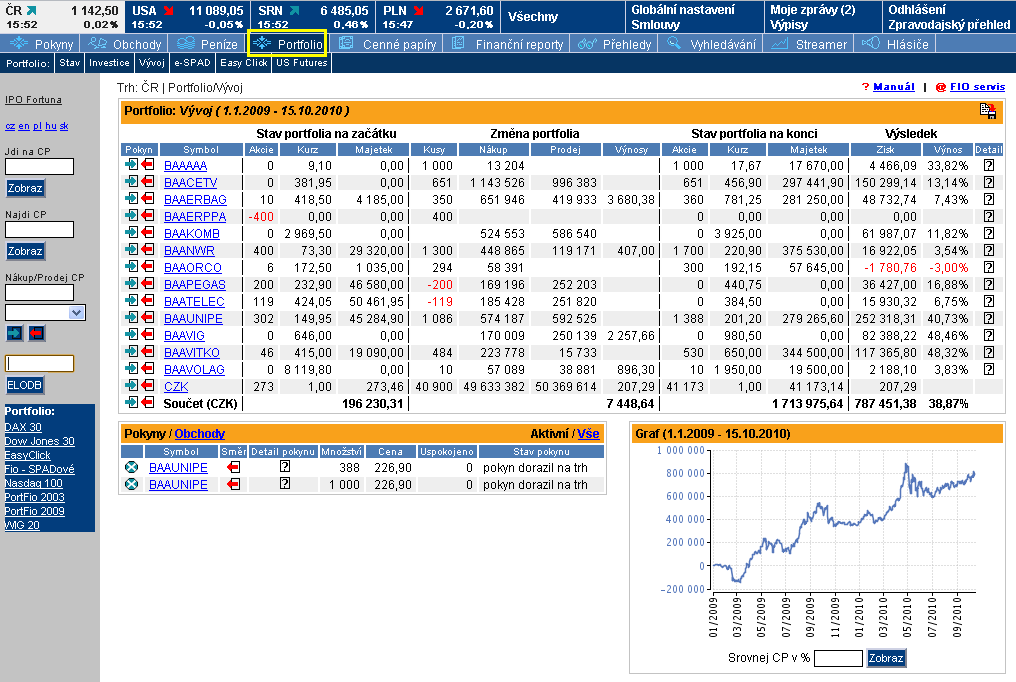
Portfolio
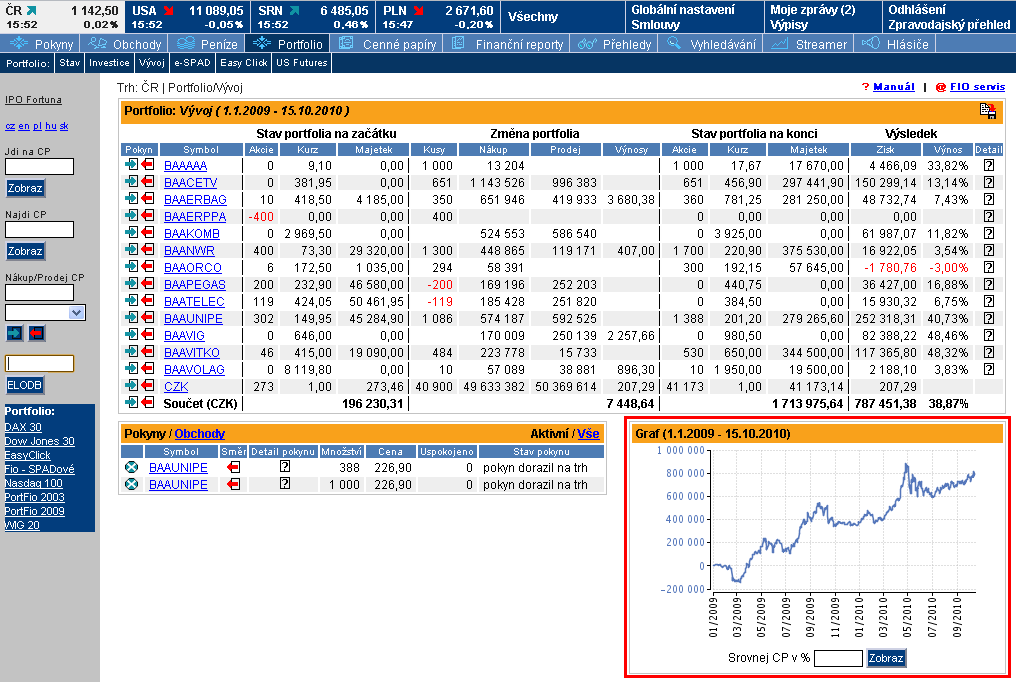
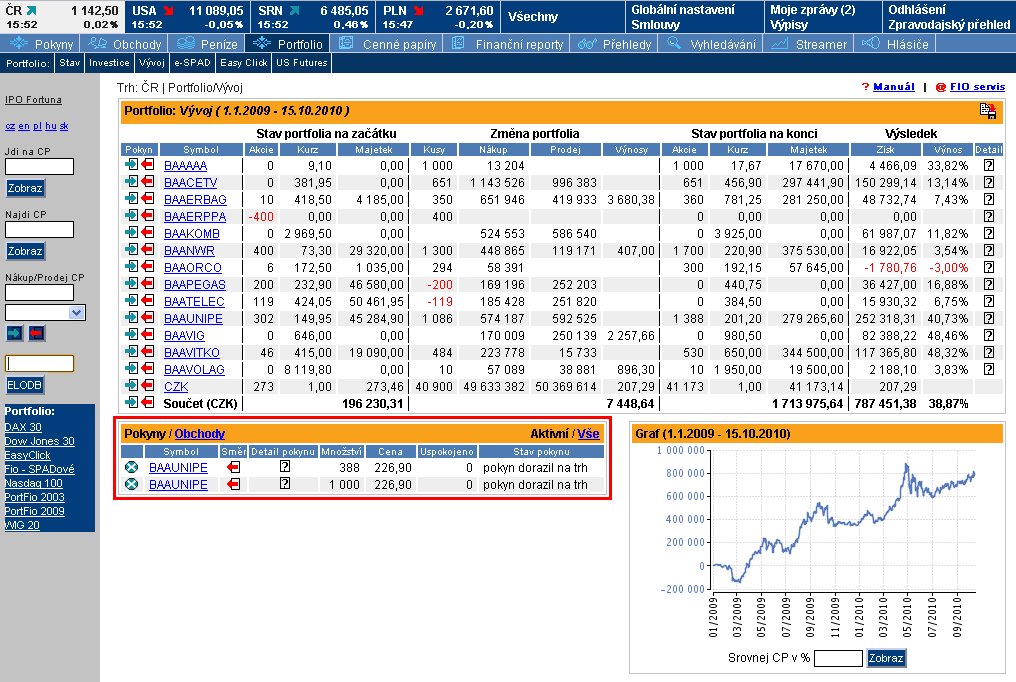
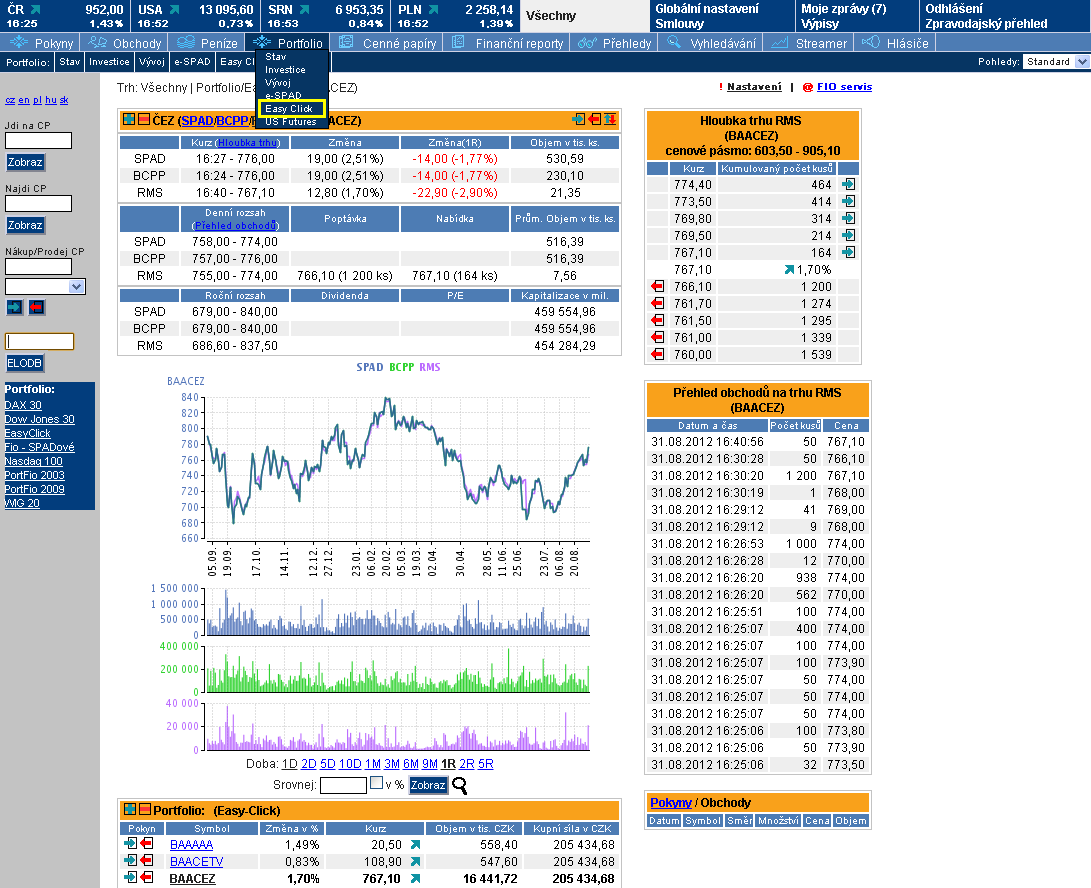
The e-Banker application facilitates updated and continuous monitoring of developments in your portfolio using the "Portfolio" tabs.
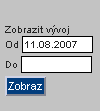
These tabs provide details of bought securities with current prices, news, a graph of portfolio development and of developments in individual securities as well as overviews of submitted and completed orders. Portfolio development can also be monitored over a pre-defined period of time.
Portfolio development and the developments in individual securities can be compared against any other security title.
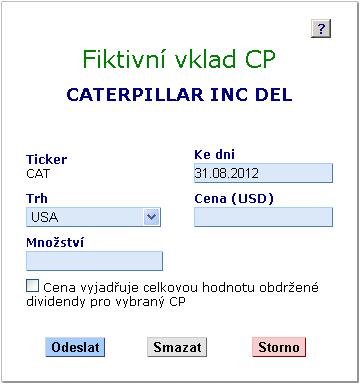
You can also fictively add other securities that you decided not to purchase through a broker but that you still want to monitor in your portfolio. Securities can be added to or removed from the portfolio for monitoring purposes only using the blue plus or the red minus symbols.
The EasyClick section is also located in the "Portfolio" tab and allows the user to monitor all the securities traded using EasyClick orders on the RM-SYSTEM Czech stock exchange. This section includes detailed graphs, the depth of the market and an overview of all completed
Securities
Securities Information
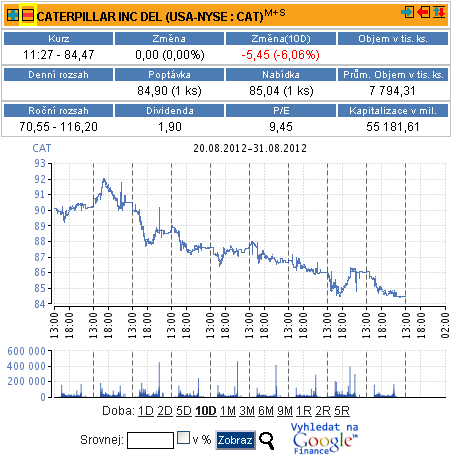
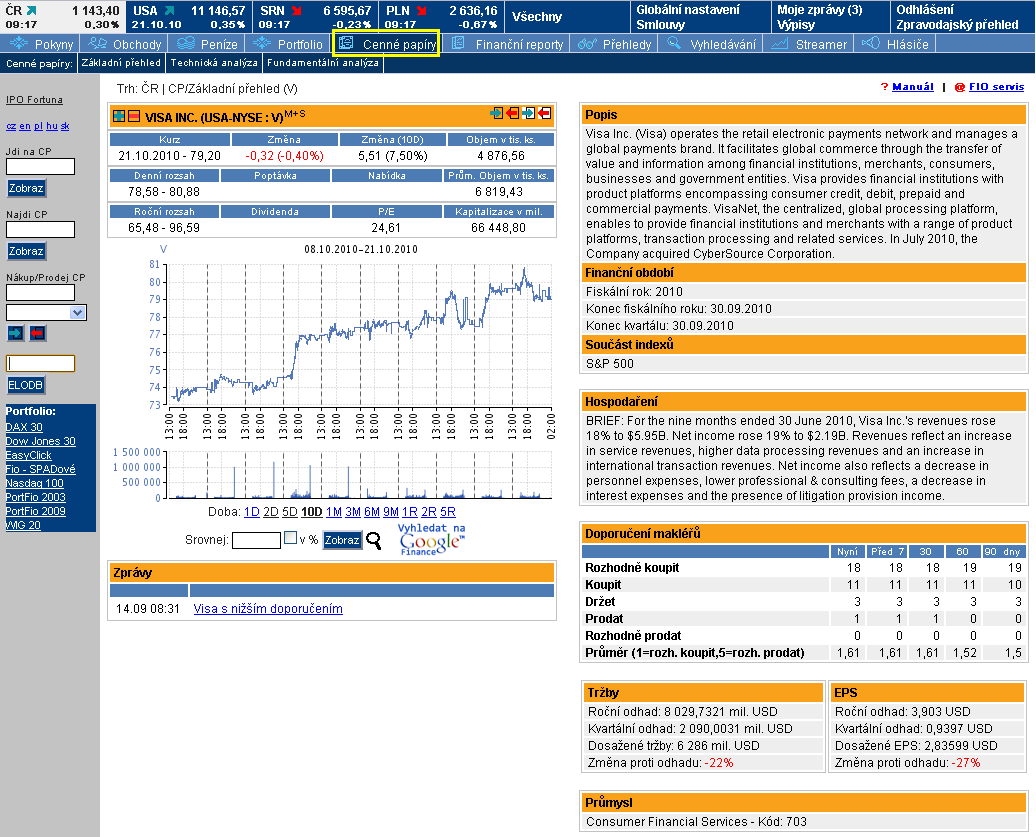
Securities information is provided though the "Securities" tab, which provides detailed information about a selected title including a basic overview or more complex technical and fundamental analysis, both of which are important tools for making investment decisions.
The "Basic Overview" section provides additional information about the selected title including information about the issuers, financial indicators, revenues and broker recommendations.
Financial data shown in the right-hand column is provided by one of the most prestigious agencies in the world, Thomson Reuters. The basic description of the issuer of the given stock briefly describes the company's main lines of business. This information is also available in English. Below, more information on the date earnings are released for the previous quarter and the date on which the company's fiscal year ends is also provided. A set of financial indicators is also available for the selected title regarding the company's equity, number of issued shares, revenues and profits for the given period.
Broker recommendations are also directly from the Thomson Reuters agency. A rating of 1 to 5 provided for every security title indicates buy, hold or sell recommendations (1 - definitely buy, 2 - buy, 3 - hold, 4 - sell, 5 - definitely sell). In addition to the current recommendations, recommendations for the previous week, two months and quarter are available as well. An average is shown in the final row after all the other assessment criteria.
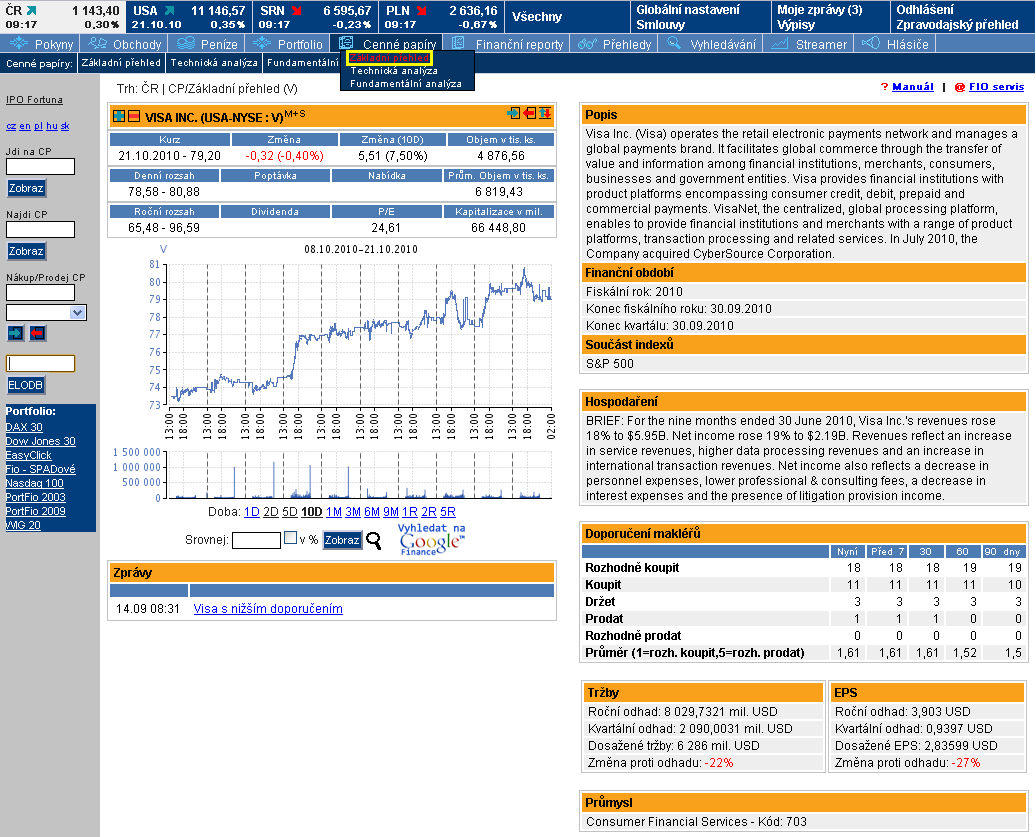
Technical Analysis
The purpose of technical analysis is to use historical data and trends to predict future development in the price of a security. The "Technical Analysis" section provides a broad range of indicators that you can use to analyse a specific security. The individual functions are transposed directly into the security's graph or under the primary graph showing the price of the security separately. Of course the time over which the selected indicator is shown is completely selectable and the selected security can be compared to other securities and index performance as well.
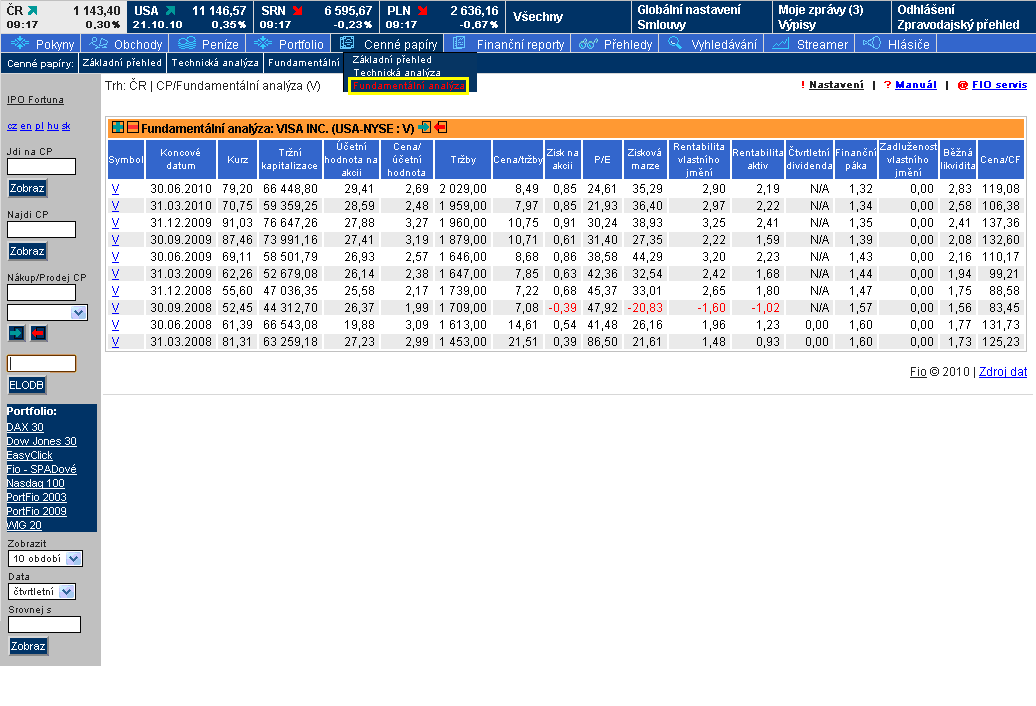
Fundamental Analysis
Fundamental analysis is an important part of the investment decision-making process and is used to assess the current financial situation of a security's issuer. In the "Fundamental Analysis" section there is a huge quantity of information and financial indicators available to help satisfy your specific needs. A pre-defined set of information is displayed for selected companies including the security's symbol, price, market capitalization, revenues and many other details. The selected company can be compared to other companies and the indicators and financial data are shown in rows in order to make the comparison as transparent as possible.
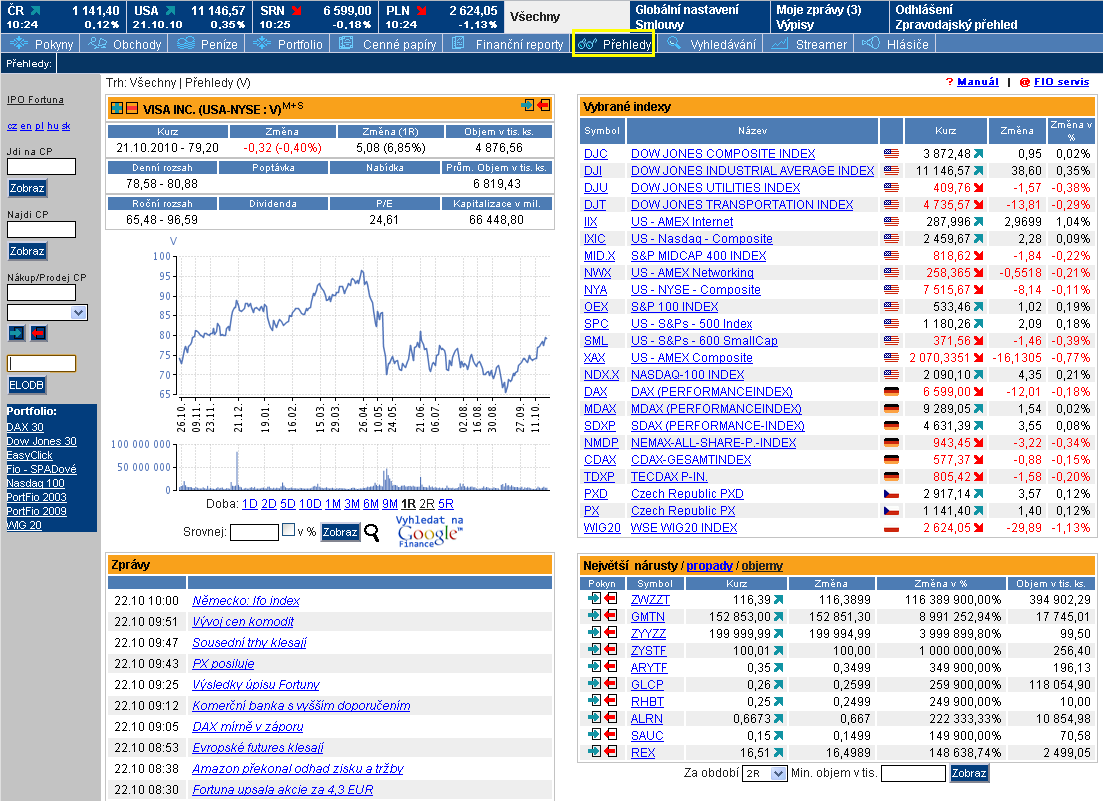
Overview of Stock Market Developments
e-Broker also provides a complex overview of the current status and development of the world's capital markets and indexes. The "Overview" tab shows a portfolio of more than 20 selected global indexes plus an overview of the security with the greatest increase or decrease in price and an overview of the security with the highest trading volume. This section offers active investors the important information they need to make investment decisions in one convenient location. Another convenient option is the ability to quickly submit orders that are pre-filled using data directly from this tab.
The portfolio of selected indexes provides information on each index's current level, any changes and ticker while more detailed information including a graph can be opened simply by clicking on the name of the index.
Settings
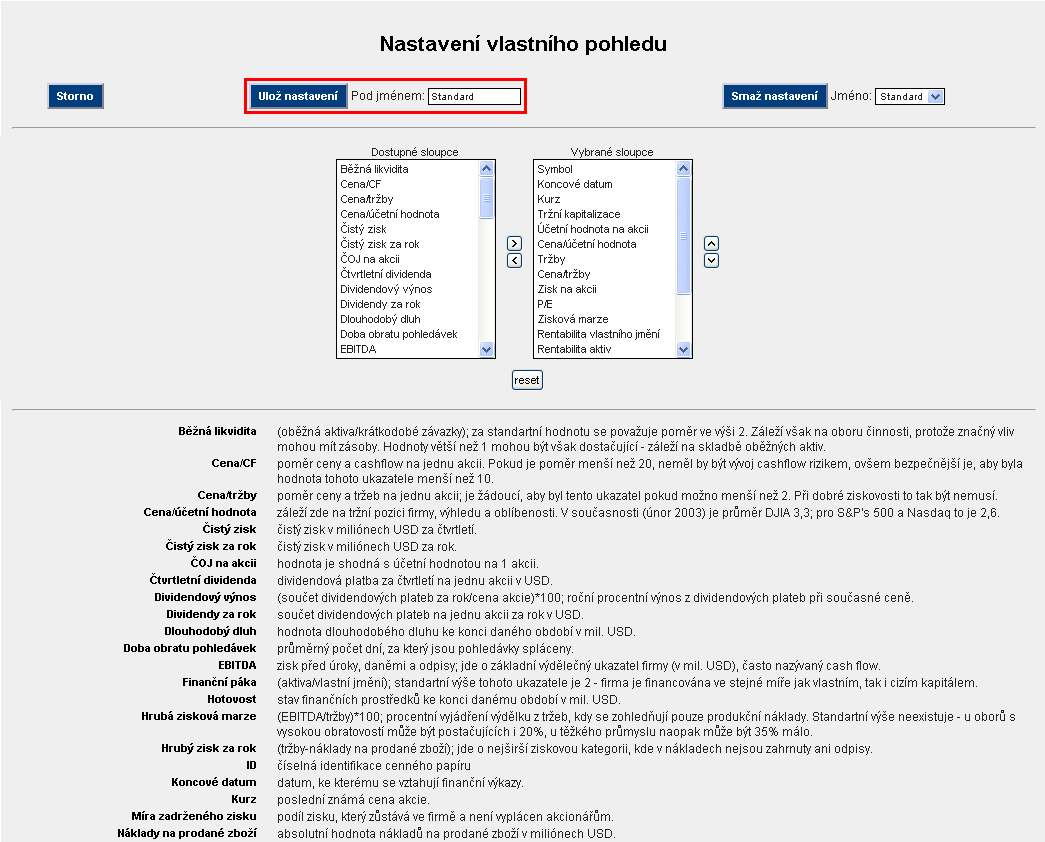
Individual Application Settings
The e-Broker application features a very simple way for users to change the way data is displayed in the individual tabs and can be customized to each individual's needs. The standard default settings always show the basic, most essential information but the user has the option to define various profiles and names for a number of custom displays or can change the default settings and define the specific information to be displayed. Such information can be adjusted based on the client's needs.
All data (shown in columns) can be adjusted using the "Settings" section in the upper right-hand corner of the application.
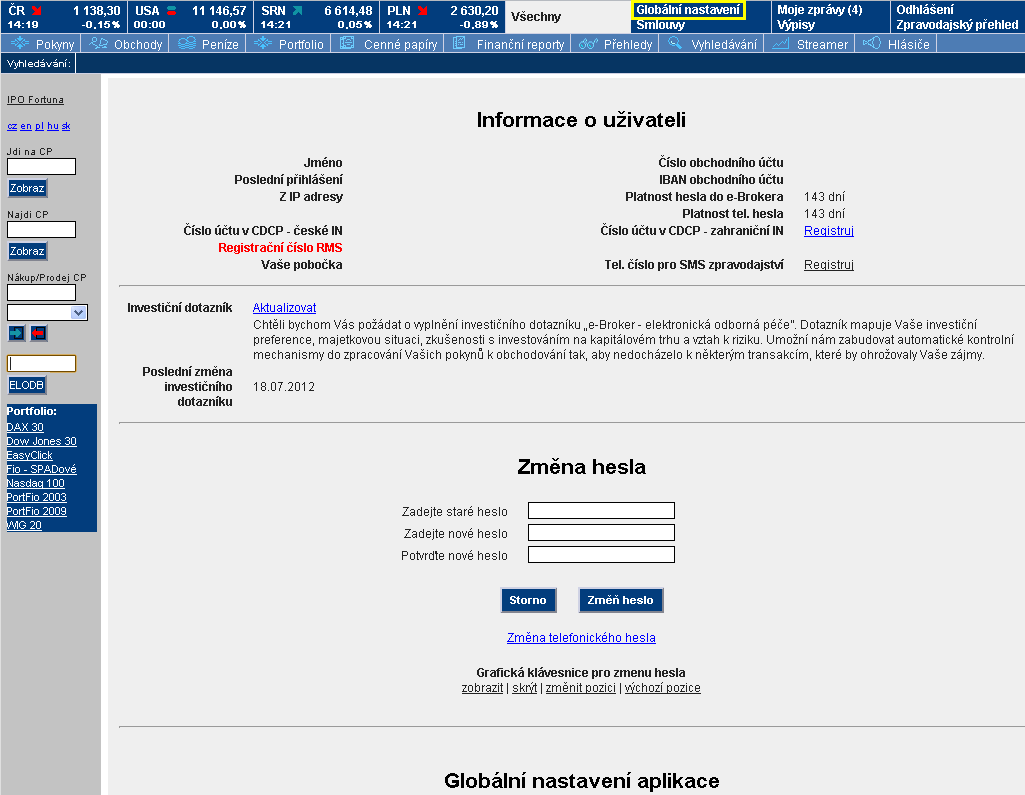
Global Settings
"Global Settings" are available from the main menu on all pages of the e-Broker application and are used to define basic parameters:
CHANGE PASSWORD
We recommend changing your password immediately upon your first login and then on a regular basis, at least once every 6 month.
LOGOUT SETTINGS
Users are automatically logged out after a specific period of time of inactivity in the application; the user's password is then requested to continue using the application. We recommend setting this to the smallest period, e.g. 10 minutes.
ALLOW NEW PROPERTIES FOR USA ORDERS
This provides access to expanded parameters for USA orders including directing an order to a selected ECN market, special validity or intelligent orders issued to individual ECN markets. We only recommend this service for clients with in-depth knowledge of trading in the USA.
DEFAULT DISPLAY CURRENCY
You can select from the following currencies: CZK, EUR, PLN or USD. The full value of your portfolio will be displayed in the selected currency.
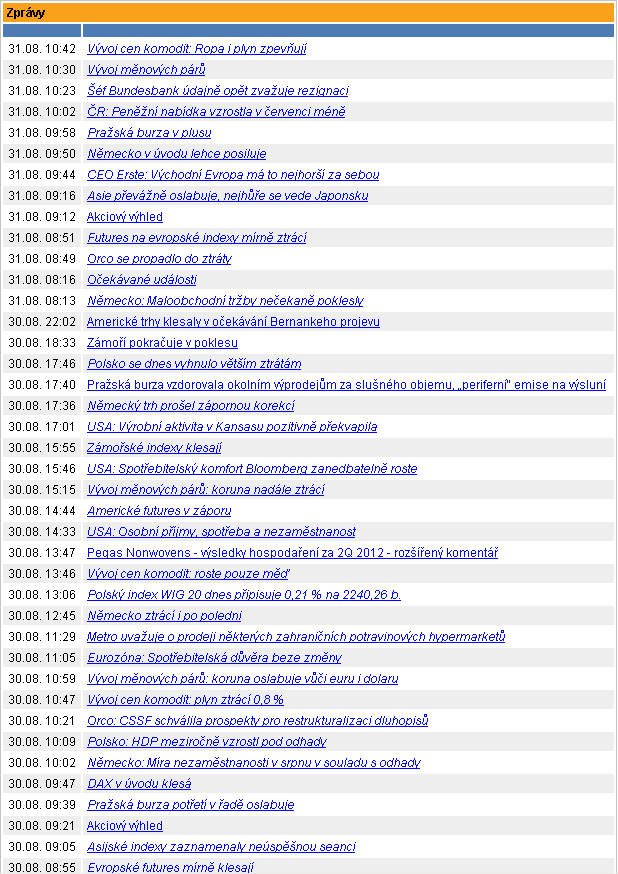
DISPLAY NEWS/FORECASTS
You can define the range of news reports and forecasts to be displayed in the small overview of orders and trades on the portfolio page.
ZOOM USING DAYS SHOWN ON A GRAPH
You can enlarge the graph of shares and change its size as well. This functions works for technical analysis and helps to make it more transparent.
Subsection Settings
Additional parameters used in the individual subsections can also be defined. The following subsections are involved:
- Orders
- Trades
- Cash
- Securities - Fundamental Analysis
- Portfolio - Balance
- Financial Reports
After opening the subsection and clicking on "Settings" in the page's heading you can then change the standard settings and rename the subsection as you wish. This allows you to adapt the page to match your needs. After your next login, your settings will be displayed and you can change and adapt them at any time to suit your needs. Click on "standard" to return to the default settings.
Other
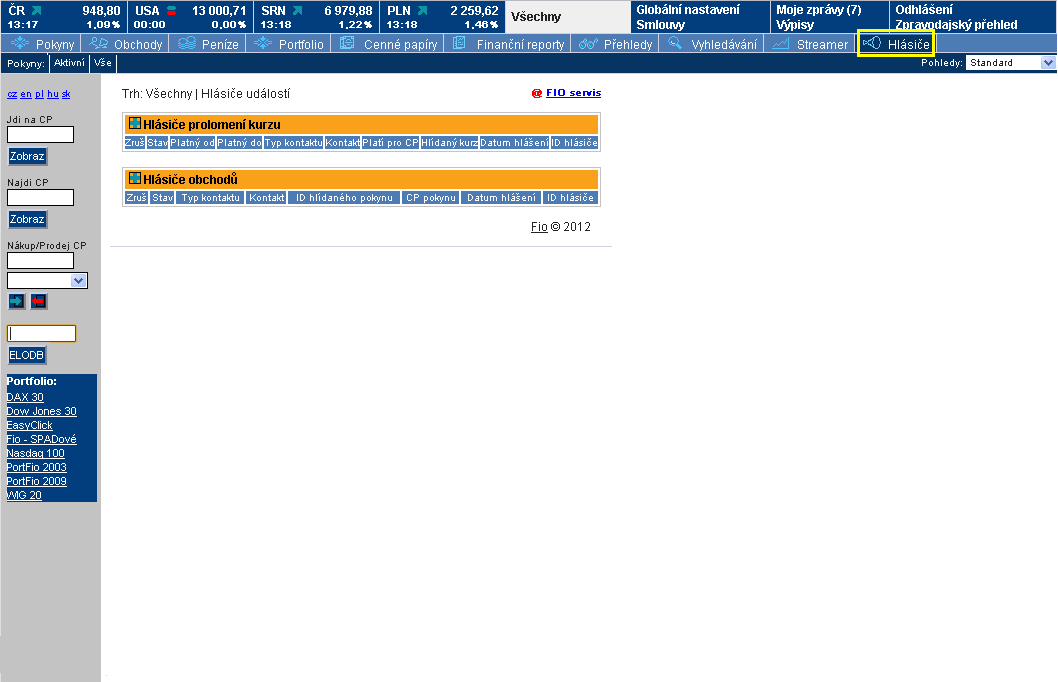
Alerts
In the "Alerts" tab you can define the types of information to be sent via email or to your mobile phone. These messages are sent automatically and immediately after a pre-defined condition occurs. Fio uses a specialised external company to ensure that all SMS are delivered to all client numbers on all three Czech mobile phone operators. All clients registered for this service receive an SMS in a matter of moments after its creation.
Every message contains one of the following types of information depending on the selected alert:
- Information as to when a selected price level has been reached for a given security
- Information on the completion of a trade when a given trade is fully or partially complete
SERVICE ACTIVATION CONDITIONS AND PROCEDURE
- The price for this service is CZK 2 for every SMS while email messages are sent free of charge.
- The fee for sending an SMS is automatically deducted from the client's trading account as a lump sum at the end of the calendar month.
- There is no need to sign a new contract, simply register for Alerts with us.
- The Alerts service is only available to clients of Fio banka, a.s. with a valid commission contract.
- Alerts can only be activated for telephone numbers belonging to the networks of Czech mobile operators.
SERVICE REGISTRATION
The "Alerts" link is located in the e-Broker application directly on the main horizontal menu. If a user wants to set up an alert once an order is satisfied, he or she simply needs to select this option from the drop-down box and enter a phone number or e-mail address for message delivery. If you want to set up an alert once a price is reached, enter the identification of the selected title and the given price.
Streamer
Streamer provides access to streaming prices for securities in real time. This option provides even faster reactions to market situations even when a portfolio is composed of multiple securities
- Streaming data and prices for securities in real time
- Up to 15 individual portfolios with up to 20 different titles in each can be created
- A streaming graph for the currently displayed title in the portfolio is available
STREAMER PRINCIPLE
Streamer shows every change in price and other important information immediately when it happens on the market. There is no need to refresh the page as with the standard e-Broker application. If a change in a bid or the number of shares in a bid occurs, the change is automatically reflected in the portfolio and is highlighted with a coloured background.
If you are actively trading and use small price deviations Streamer can give you a critical competitive advantage over other investors.
ACTIVATION CONDITIONS AND PROCEDURE
This service is provided for a fee of CZK 780 per month. This amount is automatically deducted from a trading account on the first day of the month. The service is accessed directly from the e-Broker application using the Streamer tab. You can register online by entering your password to the e-Broker application and indicating your consent to the given conditions. Online market prices must be enabled in the Global Settings of the e-Broker application in order to ensure the service functions properly.
The service is provided free of charge until the end of the calendar month in which you register. Essentially this provides you with a free trial of the service. If you decide to cancel the service, simply cancel it in the e-Broker application in the Streamer tab.
SMS News
If you happen to be away from an Internet connection and a computer, you can still register for SMS news from Fio banka. A number of times a day the latest prices from the PX Prague Stock Exchange, other global stock exchanges and up-to-date information from capital markets and recommended securities will be delivered directly to your mobile phone. This service is most frequently used by actively trading clients who want to have key information available anywhere and all the time. You can register for the service directly in the "Global Settings" in the e-Broker application.
Fundamental Analysis
Fio provides its clients with standard news and fundamental data on companies, both of which are a critical part of the investment decision making process. Fundamental analysis is available in the e-Broker application in the "Securities" section accessible from the main menu.
The following basic data is included in fundamental analysis: market capitalization, book value per share, price / book value, revenues, price / revenues, earnings per share, P / E ratio, profit margin, return on equity, return on assets, dividend yield, and much more.
An even greater range of information and data is available in the "Financial Reports" section of the e-Broker application. Here clients will gain more in-depth financial information about the companies pursuant to applicable accounting standards.
Market capitalization
Company market capitalization. This value is obtained by multiplying the number of shares issued by the company by the market price per share. Market capitalization approximates the size of the company by measuring its total value.
Book value per share
Book value per share = (Equity - Priority shares) / Number of common shares. This number allows the definition of the value of shares based on the financial statements issued by the company. This can then be used to define the market value of a share.
Price / book value
This value increases with larger and better companies. The number drops for lesser known companies and those with unclear futures. The average for companies listed on the DJIA is 3.5, while it averages 2.8 for companies on the S&P 500 and 2.6 for companies on the NASDAQ.
Revenues
Company revenues for the past accounting year. Companies in the USA often use an accounting year that differs from the calendar year.
Price / revenues
The ratio of price and revenues per single share. This value should be lower than 2. This number may be significantly higher but only if profitability is exceptional.
Earnings per share
This is the most monitored value for every company. This information provides stockholders with an indicator of a company's success. Dividends can be distributed from a company's net profits, which are always paid annually or perhaps quarterly as is the case for American companies.
P / E
The current stock price / earnings per share. There is no "correct" value, much the same as for "Price/book value". It corresponds to the period in which the company's after tax profit matches its market capitalization. For instance, a P/E of 15 means that the company's current performance is equal to its market value over a period of 15 years. The average P/E for a company listed on the DJIA is around 30 while it is around 32 on the S&P 500 and 37 on the NASDAQ.
Profit margin
Net profit / total revenues x 100. This percentage expresses net profits in terms of company revenues.
Return on equity
ROE, net profit / equity. This indicator represents the company's ability to earn a return on its equity.
Return on assets
ROA, (net profit + interest after taxes) / total assets. This indicator represents the returns generated on total assets.
Dividend yield
The dividend per single share / share price. Annual yield percentage is derived from dividends at the current price. For most stockholders this is the only return from holding a share in addition to the returns from increases in the price of the share.
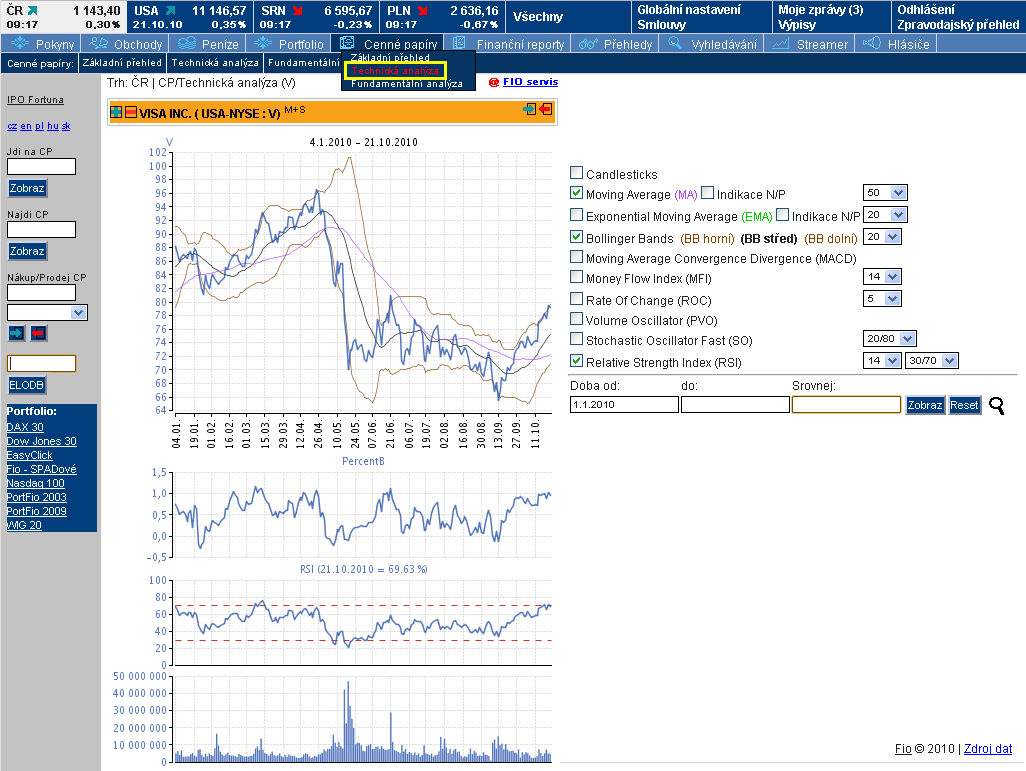
Technical Analysis
Clients who are focused on reading graphs and other data when investing will certainly appreciate the "Technical Analysis" section. One benefit is that you are allowed to define the parameters yourself in addition to the range over a number of days. Technical analysis is used to best time buying and selling stocks and can be a major contributor to success in investing when combined with Fundamental Analysis. It is primarily used for short positions and short-term trading with shares.
"Technical Analysis" is available in the "Securities" section, which is available from the main menu in the header of every e-Broker page.
Candlesticks
This graph used to show every day as a candlestick representing information on the open and close prices as well as daily maximum and minimums whereby the colour of the "candlestick" corresponds to the daily increase or decrease. This is frequently used in combination with Bollinger Bands in order to provide a more precise assessment of trading signals. The graph is primarily used to show the price over tens of trading day.
Moving average (MA)
A multi-day average price with buying/selling activity noted. You can select the 5, 10, 20, 50, 100 and 200-day average. The client can select the number of days based on the trend the client wants to follow: very short (5-13 days), short (14-25 days), short mid-term (26-49 days), mid-term (50-100 days), or long term (100-200 days). The buy/sell indication occurs after MA allocation. The longer the period, the more reliable is this indication.
Exponential moving average (EMA)
A multi-day average price with buying/selling activity noted. You can select the 5, 10, 20, 50, 100 and 200-day average. EMA is slightly more reliable than MA as more distant dates are given lesser weights in the calculation. The number of days is selected the same as for MA. The buy/sell indication occurs after EMA allocation. The longer the period, the more reliable is this indication.
Bollinger bands (BB upper / middle / lower)
A band represents the limits of a fluctuating average. The width of the band is given by the volatility of the stock price. The more narrow the band, the lower the fluctuations in the price for the given title and vice versa. This typically follows a more significant change in prices after a longer period with lower volatility. The connection of the Percent B indicator precisely defines the current price compared to the width of the Bollinger Bands. A value between 0 and 1 indicates a price inside the band.
Moving Average Convergence Divergence (MACD)
This is frequently considered the most reliable indicator. It is based on subtracting the long-term (26-day) sliding average from the short-term period average (12-day). The graph shows the trigger level (9-day MA), which generates buy and sell signals. The MACD indicator oscillates around zero. Buy and sell signals are generated when the MACD is above the trigger level and is stronger the farther from zero the MACD happens to be.
Money Flow Index (MFI)
This momentary indicator measures the strength of cash flowing into and out of a stock. It works using price and volume. This indicator fluctuates between 20 and 80 and the closer it is to these boundary values, the higher the likelihood of a change in price.
Rate of change (ROC)
A per cent change in price over a selected period. It is used to show 5 or 10 days of changes. The indicator oscillates around 0 and deviations from this value indicate changing trends. When the value crosses a level of 0 this changing trends is confirmed by the signal.
Volume oscillator (PVO)
The difference between two MA volumes for given stocks. This indicator is independent of the price of the stock. It is used to confirm a trend. A rising price + increasing volume = more buyers and additional growth is probable. A declining price + increasing volume = more sellers and further declines are probable.
Stochastic oscillator (SO)
This indicator shows where the last closing price is compared to the pricing range. 0% corresponds to the five-day minimum and 100% to the maximum. Percentage limits of 20/80, 25/75 or 30/70 can be defined as the trigger levels.
Relative strength index (RSI)
The relative strength index considers the average positive and negative changes in price over a selected period of time. This indicator moves within a range of 0-100, wherein a value over 70 indicates overbuying and a value under 30 indicates overselling on the market. The exact number value for the RSI is expressed in the header of the graph and different zones can be selected: 30 / 70, 20 / 80 (for volatile titles) and 40 / 60 (for indexes).
Security
Fio e-Broker protects you but is not restrictive. You are free to select your own level of security. Higher levels of protection are recommended but are voluntary.
SMS Authorization Code
You can select the option to confirm every order using an authorization code sent via SMS to your mobile phone.
Authorization Code Length
- Customizable, from 5 to 10 characters
Number of Attempts
- Select from 1 to 3 attempts to confirm an order using an authorization code.
Validity
- Code validity may extend from 1 minute to 15 minutes.
User Name and Password
Access to the application is protected by a user name and password, which must be changed every six months. The password is encrypted when entered and is not accessible to Fio employees.
Financial Account Security
Funds can only be transferred from the e-Broker account to the pre-approved account agreed in writing in your contract.
Graphic Keyboard
All characters when entering a password must be entered by clicking the mouse on a graphic keyboard. This protects your password against key loggers and eyes that may wander a bit more than normal.
Encrypted Communication
Any information transferred between the client's computer and the Fio server is electronically encrypted using the SSL 128 bit standard.
Other ...
We don't disclose all of our security elements. Security has always been and will continue to be the centre of our attention.
Setting up your security settings
You can make changes to your securities settings in person at any Fio branch.
Electronic professional due diligence
Electronic professional due diligence (hereinafter only EDD) is a project involving Fio banka, a.s. as a securities broker with implementation following the provisions of Section 15 of Act No. 256/2004 Coll. Business on Capital Markets and from the statements containing similar provisions from the Securities Commission.
These provisions place the duty on licensed securities brokers to provide investment services with proper professional due diligence (Par. 1, Letter a) with the goal of determining the customer's investment goals, financial situation and the scope of the customer's expertise and skills (Par. 1, Letter b, and Par. 3). The EDD Project introduces a range of automated control mechanisms that have the goal of identifying orders that if executed would expose the client to increased risks above those identified in his or her investment goals, experience or financial situation.
So that a Fio banka, a.s. trader gets all the correct information from the client, the client must provide information in order for the trader to complete proper professional due diligence in the investment questionnaire upon signature of the commission contract. If any such information provided by the client changes, the client can update the information at any time through staff at the branch that manages the trading account or individually using a change form in the Global Settings of the e-Broker application. The client can also change this information at any time if it is incorrect or inaccurate. The validity of data shown in the questionnaire is one year from the most recent update and new orders can only be placed after this date once the previous data is updated or confirmation is received that no changes have occurred.
If the EDD control mechanisms determine that an order placed by a client poses a potential risk to that client that does not correspond to the details shown in the Investment Questionnaire, the system will stop the order and display a warning alert to the client. If the client agrees to such risk despite such warnings then the order can be authorised by pressing "Send". If not, the order will not be processed. If the broker determines though EDD and by comparing information shared in the Investment Questionnaire that the given investment is strongly opposed to the selected investment strategy, the processing of any such order will be blocked without the broker's authorization to bear such risk.
If you encounter any problems related to EDD, please do not hesitate to contact your branch or send a message using the Fio service link accessible in the e-Broker application.


